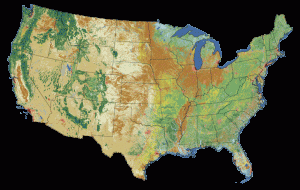
The most comprehensive satellite-gleaned view of land-surface conditions from coast to coast in the conterminous United States is an eye-opener!
Just issued by the U.S. Geological Survey (USGS), this latest look-see shows land-surface conditions from coast to coast, showing the extent of land cover types from forests to urban areas.
The National Land Cover Database (NLCD 2011) is being made available to the public by the USGS and partners. It divides the lower 48 states into 9 billion geographic cells.
This informative database spotlights land cover and is based on Landsat satellite imagery taken in 2011.
Sweeping, yet amazingly precise
Land cover is broadly defined as the biophysical pattern of natural vegetation, agriculture, and urban areas. It is shaped by both natural processes and human influences.
Collected in repeated five-year cycles, NLCD data is used by resource managers and decision-makers to conduct ecosystem studies, determine spatial patterns of biodiversity, trace indications of climate change, and develop best practices in land management.
“America’s land and waters face unprecedented challenges from natural disasters, climate change, development pressures, and population growth,” said Anne Castle, Assistant Secretary of the Interior for Water and Science. “The digital view that the National Land Cover Dataset affords us is sweeping, yet amazingly precise. It is one of the most important tools, for the Department of the Interior or any other land or water manager, in fostering an impartial perspective of landscape dynamics.”
Carefully calibrated
According to the USGS, the carefully calibrated data enables managers of public and private lands, urban planners, agricultural experts, and scientists with many different interests (for instance, climate, invasive species or hydrogeography) to identify critical characteristics of the land and patterns of land cover change, informing a variety of investigations from monitoring forests to modeling water runoff in urban areas.
Additionally, NLCD editions from 2001 to 2011 have been integrated to provide a 10-year land cover change comparison for our nation at five year intervals.
Critical information
Having a decade of change information readily available for any location enables users to better understand the trajectory of land cover change patterns and provides specialists with critical information to advance the understanding of land cover change processes.
NLCD 2011 products will be also released for Alaska later this year.
For more information on this new product — and to download NLCD data free of charge, go to:
By Leonard David

